Does your company continually wrestle with the question of how much money should be spent on marketing? Or how about this dilemma: how much you should spend on marketing channels in order to generate the best ROI (Return On Investment) for your marketing budget? If you’re currently seeking answers to these seemingly simple questions, you’re not alone
To give you some insight into the these questions, we’ve compiled a range of helpful surveys and reports for you to check out. While no single one offers a magic bullet solution to your “how much should I spend?” quandary, each offers a slightly different take on current research into effective marketing spending.
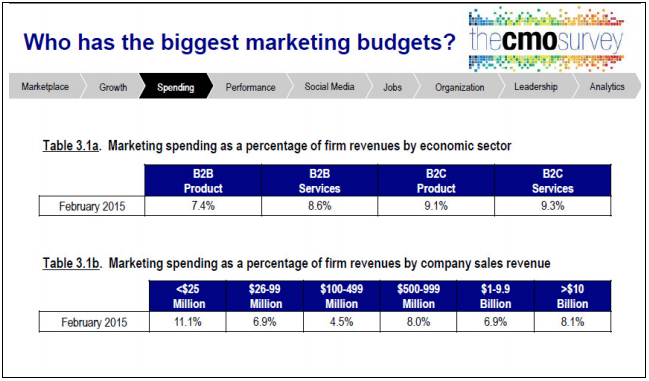
For starters, check out the following CMO survey. In the charts below you’ll see how marketing professionals from all types of firms responded to this question in 2015.
The main takeaways:
It might not surprise you to find out that B2C firms are spending more on marketing than B2B firms. However, the spending for B2B firms increased from the same 2013 survey.
When it comes to spending based on the size of the firm, the survey showed significant differences.
Another report from Forrester Research shows the estimated allocation of marketing funds offline versus online and across the digital channels. This report is perfect for taking a stab at that frequently asked questions, “how much of my marketing budget should be allocated to digital channels?” And let’s not forget the equally important question that might keep you up at night: “which online/digital channels will show the best returns for my marketing budget?”
Here are some conclusions from that report:
Companies expect to allocate 30% of their marketing budget to online in 2017. If that already seems significant, this rate is expected to grow a whopping 35% in 2018. Are you surprised to learn that online spend for search engine marketing will capture the largest share? Taking the next largest share is online display, including banner ads, online video, etc.
A few more fascinating data tidbits from the report:
- Social media investments will only represent about 15% of the total online spend, but is expected to grow.
- Mobile marketing is presumed to be across all channels and thus is no longer tracked independently.
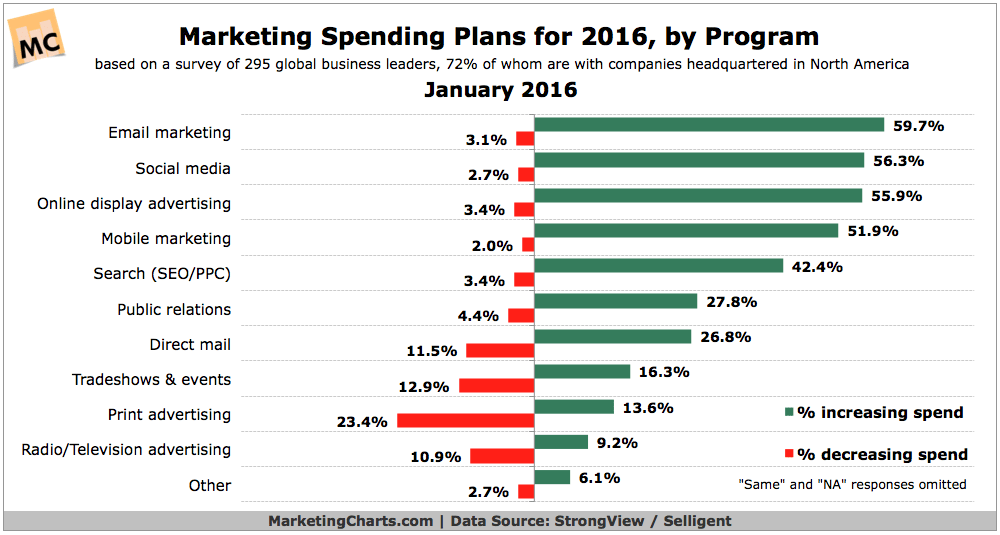
- The chart below shows strong increases in digital channel investment. Of the five digital tactics represented in the report, each expected to see at least a 42% increase in investment.
Of course, it’s crucial to remember that every business, and every marketing plan and budget, represents a unique situation. The way that marketing funds are ultimately allocated is driven by the nature of the business, the competitive marketplace, and how target customers behave through the buying funnel.
Which Marketing Strategies & Tactics Are Getting The Best Results?
In these recent surveys by leading digital marketing research firms, respondents reported on what marketing activities generated the best ROI.
Which Social Media Channels Should I Invest In?
That’s a great question–but one that’s easier to ask than answer.
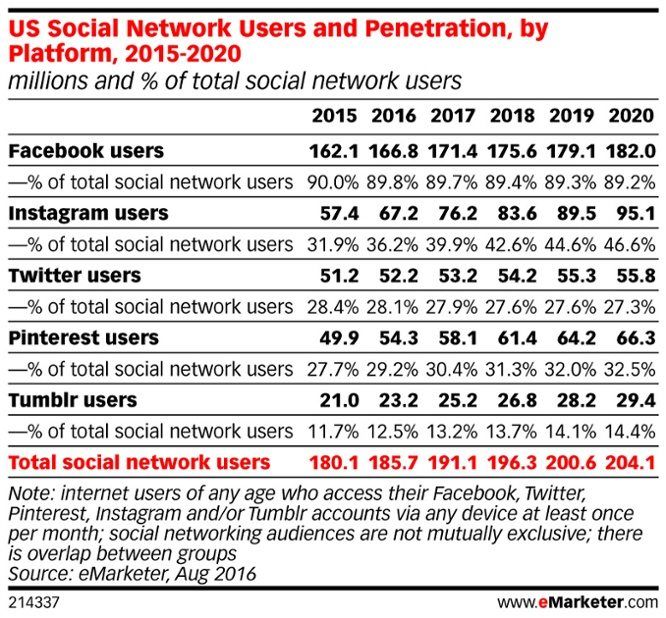
Let’s try to break it down with the 2016 eMarketer report, which forecasted social media penetration through 2020. Some conclusions from the report indicate that Facebook is expected to continue its reign as king, with 90% of social media users utilizing in the platform. Instagram is expected to grow, from 32% penetration to 47% by 2020. Pinterest and Twitter will continue to have relatively low penetration, peaking at around 33% of users by 2020.
The bottom line? This data would indicate that Facebook and Instagram are the best channel investments. However, each company’s target market should be researched thoroughly before assuming general online/digital marketing strategies.
Digital Channel Investment Changes in Specific Channels
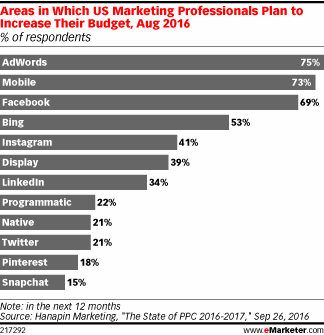
Another eMarketer August 2016 report indicated that 75% of respondents expect to increase their Google Adwords investments in the next 12 months–that’s more than any other digital channel. Facebook (apparently not always king) came in second with an expected increase of 69%. Instagram and Twitter investment increases were 41% and 21%, respectively.
Here are some big numbers for you–ready? eMarketer projects the following: “in 2017, TV ad spending will total $72.01 billion, or 35.8% of total media ad spending in the US. Meanwhile, total digital ad spending in 2017 will equal $77.37 billion, or 38.4% of total ad spending.”
Yeah, you read that correctly: $77.37 billion.
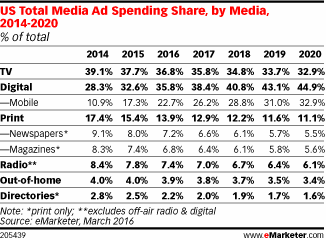
This indicates for the first time in history that digital spend will surpass TV ad spend in the US.
Yep, these spending forecasts are seriously historic.
Percentage Of Marketing Budget Spent On Digital
Digital spend is only a portion of total marketing spend for most businesses. For 50% of businesses surveyed, digital represents less than 40% of total marketing spend.
Digital Budget Summary – What Do I Need To Know?
Every business and every target client are unique. Doing the right research and choosing the right digital partner is the key to achieving business goals.
If you’re taking notes, the overarching themes from the above studies include these points:
- Budgets for marketing are increasing
- Marketing spend on digital is increasing at the expense of traditional advertising channels
- Total marketing budgets are between 7 and 12% of total revenue
- B2Cs generally spend more on marketing compared to B2Bs
- More marketing dollars are being spent by smaller companies as a percentage of their total revenue

